What’s New in WINFAP 5.3? (Released September 2025)
The updates in WINFAP 5.3 allow you to implement the 2025 method which incorporates new catchment descriptors. WINFAP 5.3 will still allow you to use the 2008 method, as incorporated within WINFAP 5.2.
The 2025 descriptors include: BFIHOST19scaled, SAAR9120, FARL2015 and URBEXT2015. The derivation of these is described in Vesuviano et al., 2025.
The 2025 method is described within Vesuviano and Griffin, 2025. This includes updates to both the estimation of the index flood (QMED) as well as the growth curve. As part of this the urbanisation methods have also been updated.
In addition, the non-flood years method has now been incorporated within WINFAP directly through the addition of a Generalised Logistic non-flood years distribution.
Whilst WINFAP 5.3 is designed to be used with versions of the Peak Flow Dataset greater than 14, earlier versions can be used. In these cases, where catchment descriptors are more limited, the 2008 method will be used. Similarly, WINFAP will default to the 2008 method where the FEH Web Service export XML files do not include the additional descriptors.
WINFAP 5.2 project files will be able to be opened in WINFAP 5.3, and will use the 2008 method.
Release 5.3.9575
This release introduces updates to the method for estimating QMED from POT data. It updates the method for calculating the number of valid hydrological years. The calculation of the QMED from POT data is still based on the methods outlined in FEH 3 ‘Statistical procedure for flood frequency estimation’ (Section 12).
The developers of the POT dataset, the NRFA, confirm that where POT data is provided, it can be assumed that the hydrological year is valid i.e. all POTs within a hydrological year are valid even if there are ‘Gaps’ identified. This assumption, which was not always the case in the past, combined with the information about the valid periods is used to identify the number of valid hydrological years. See FAQ https://www.hydrosolutions.co.uk/knowledge-base/calculating-the-qmed-from-peaks-over-threshold-pot-data/ for more details.
New in WINFAP 5.2 (Released September 2024)
The updates in WINFAP 5.2 are focused on allowing you to use the latest format (version 13.03 and upwards) of the NRFA Peak Flow Dataset released in September 2024. As well as a number of small bug fixes (please see our release notes here) WINFAP 5.2 uses the additional data provided to resolve issues with events on 1st October being assigned to the wrong water year and the subsequent year being rejected erroneously.
The NRFA have released two versions of the Peak Flow Dataset. For more details please see the NRFA website.
Please also see our FAQ which summarises the differences between WINFAP 5.1 and 5.2 as well as the two Peak Flow Dataset version 13 formats.
WINFAP 5.2 will be able to read in either format of the Peak Flow Dataset, as well as projects created using WINFAP 5.1. If WINFAP 5.2 is used with Peak Flow Dataset 13.02 (or older), or a project created in WINFAP 5.1 is opened, and this is subsequently saved, the internal time stamp for events will be set to 12pm. In this way results will be consistent with those generated using WINFAP 5.1.
New in WINFAP 5.1
The latest update to WINFAP is available for download here.
The updates in WINFAP 5.1 are focused on providing additional information for gauged data, the ability to add user comments, functionality to estimate the return period from flows (and vice versa) and enhancements in the presentation and reporting of results. There have been no method updates in WINFAP 5.1.
Additional information and user comments
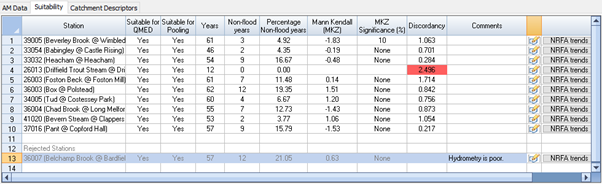
The following information is presented in the Suitability tab for the QMED Donor adjustment and Growth Curve pooling group tables. A screenshot is shown below.
- Presentation of non-flood year information within the Single Site dashboard and QMED Donor adjustment and Growth Curve pooling group tables.
- Presentation of trend information, in the form of the Mann-Kendall Z statistic and significance in the QMED Donor adjustment and Growth Curve pooling group tables.
- Ability to add comments (for example to explain why a station is rejected), within the QMED Donor adjustment and Growth Curve pooling group tables.
Estimating the return period from flows and vice versa
You can now estimate the return period from flows and vice versa from the Flood Frequency Curve Fittings table on the Pooled & QMED analysis dashboard.
Data visualisation enhancements
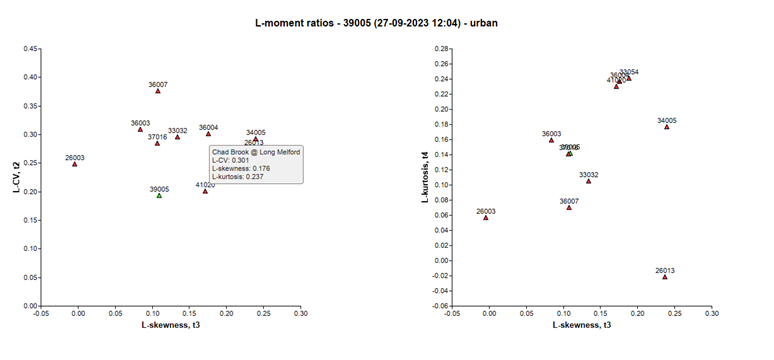
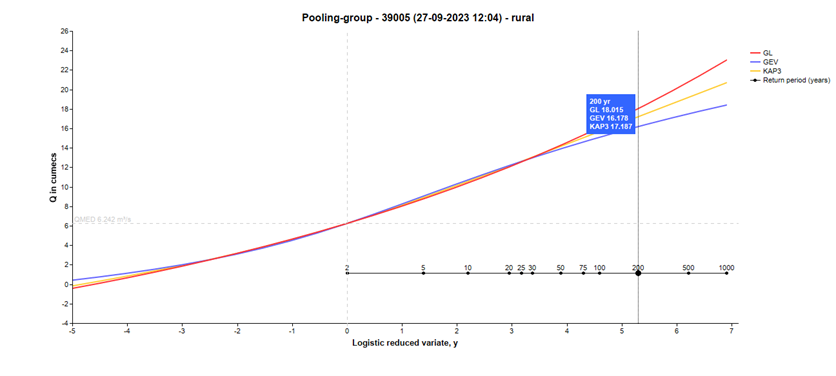
The new powerful and interactive graphics provide clearer graphs and the ability to query the data presented, including the catchment descriptor histograms, station record graphics, flood growth curves and flood frequency curves.
Examples of the L-moments graphs from the Station Record Parameters and the FFC graph are presented below. These illustrate the tool tips that can be used to query the data presented.
Report enhancements
The new pdf report incorporates the Pooled & QMED Analysis results, including main graphics and graphs, as well as user comments.
New in WINFAP 5.0 (Released September 2021)
Method Updates
- Incorporation of the BFIHOST19 descriptor in QMED estimation.
- See Griffin et al., 2019 for more information on the development of this index. BFIHOST19 is included in the FEH Web Service catchment descriptors.
- Implementation of the Small Catchment pooling group procedure and QMED donor adjustment.
- Further details are provided in the guidance for growth curve estimation and QMED estimation, and Stewart et al., 2019.
- Addition of the Kappa 3 distribution for growth curve fitting.
- Details on the development of this for the FEH statistical method are provided in Kjeldsen et al., 2017.
- Updated application of urbanisation and deurbanisation adjustment procedures. This includes:
- Pooling group L-moments can be deurbanised. This allows the estimation of the ‘rural’ growth curve using ‘as rural’ L-moments in the pooling group.
- L-moments from at-site data can be deurbanised, if required, prior to use in the Enhanced Single Site method to estimate the ‘rural’ growth curve.
- Rural QMED for gauged sites is, by default, estimated by deurbanising at-site observed data.
- User settings for deurbanisation of data for QMED and the Growth Curve are now independent of one another.
Data Management Enhancements
- Support for new catchment descriptor XML file for both the Site of Interest and the NRFA Peak Flow Dataset.
- Ability to make project-level alterations to the Peak Flow stations without compromising the integrity of the NRFA Peak Flow Dataset(s).
- Customised station data can be imported and exported for sharing and re-use across projects via use of a supplementary folder and the new Station Manager.
- Improved project file format encapsulates the entire state of a project, including custom station data, allowing projects to be distributed and co-authored with confidence.
- A comprehensive html report contains ESS/Pooled Estimation Analysis key results, parameters and modelling decisions, which can be imported directly into MS Word or pdf. (Note significant additional reporting enhancements have been subsequently incorporated in WINFAP 5.1)
- Improved copy and paste for graphs and tables. (Note significant additional graphical enhancements have been subsequently incorporated in WINFAP 5.1)